Visualisation
Pygna offers a range of plots to visualise the results of the analysis.
GNT plots
GNT barplot
paint-dataset-stats plots the results of of a GNT test on a barplot. Pass the results table generated by one of the functions and the output figure file (png or pdf). In case you are using a SP test, pass also ‘less’ as an alternative.
usage: pygna paint-datasets-stats [-h] [-a ALTERNATIVE] table-filename output-file

positional arguments:
  table-filename        pygna results table
  output-file           figure file, use pdf or png extension

optional arguments:
  -h, --help            show this help message and exit
  -a ALTERNATIVE, --alternative ALTERNATIVE
                        'greater'
Example usage: .. code-block:: bash
$ pygna paint-dataset-stats table_topology_module.csv figures/barplot_module.pdf

GNT summary
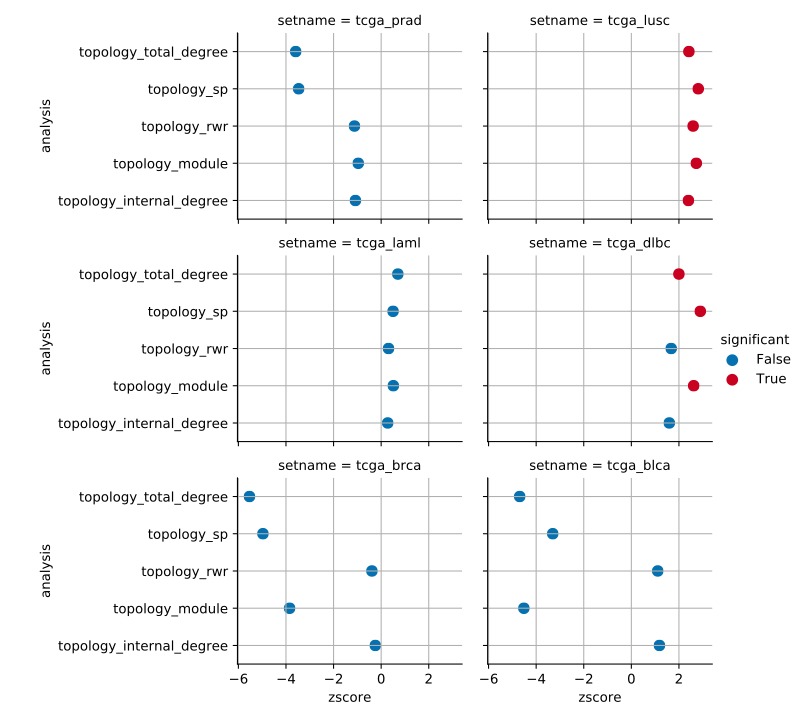
paint_summary_gnt plots a pointplot with a general summary for the GNT.
For example, given multiple GNT test results saved as table_topology_<method>.csv we could visualise all results as follows.
$ pygna paint-summary-gnt figures/summary_gnt.pdf table_topology_*
usage: pygna paint-summary-gnt [-h] [-s SETNAME] [-t THRESHOLD] [-c COLUMN_FILTER] [--larger] [--less-tests LESS_TESTS] output-figure [input_tables [input_tables ...]]

positional arguments:
  output-figure         output figure filename
  input_tables          -

optional arguments:
  -h, --help            show this help message and exit
  -s SETNAME, --setname SETNAME
                        name of the dataset (default: -)
  -t THRESHOLD, --threshold THRESHOLD
                        Value to threshold the colors (default: 0.05)
  -c COLUMN_FILTER, --column-filter COLUMN_FILTER
                        column where the threshold is applied (default: 'empirical_pvalue')
  --larger              if True the threshold is set as lower limit (default: False)
  --less-tests LESS_TESTS
                        comma separated string of the tests that are significant if lower than expected, otherwise pass empty string (default: 'topology_sp')
GNA plots
GNA heatmap
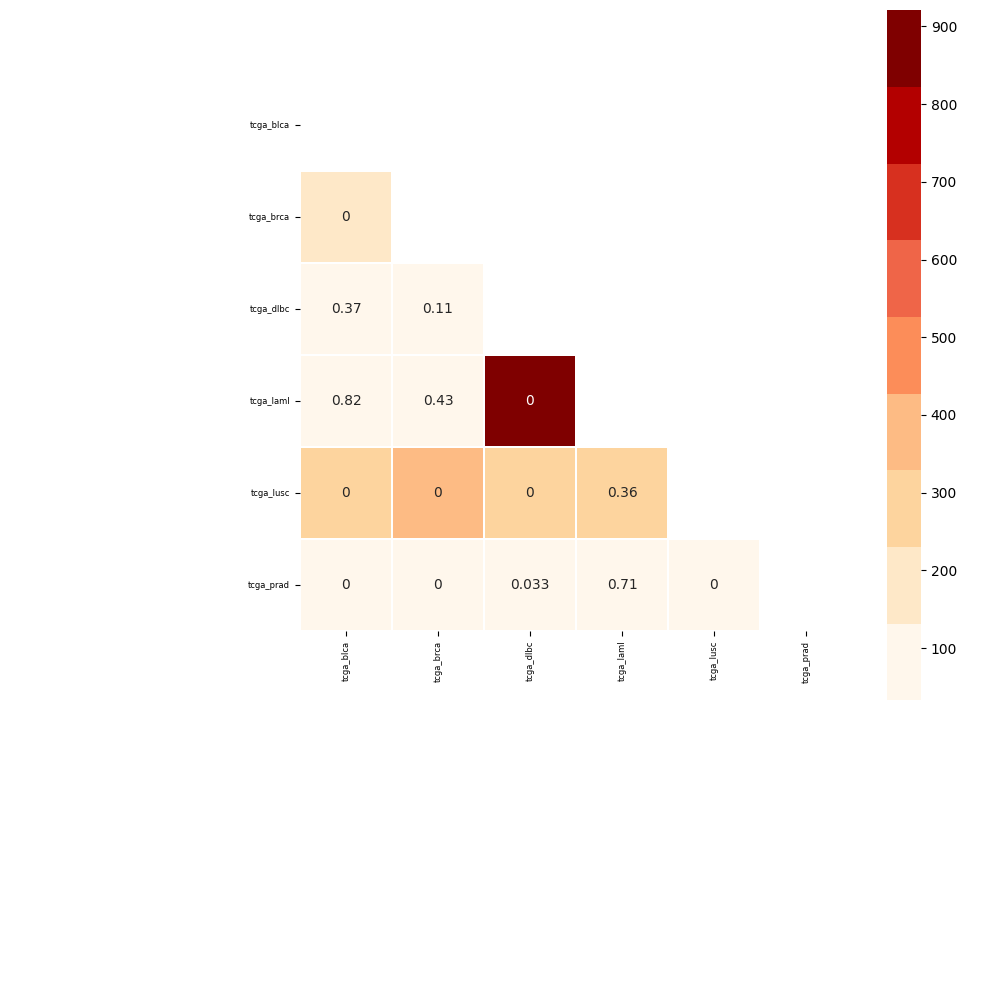
paint-comparison-matrix plots the results of of a GNA test. Pass the results table generated by one of the functions and the output figure file (png or pdf). With RWR you can specify whether the test is a RWR association, in this case a different palette and limits are sets. Specify if the results are obtained using association with only one genesets (multiple setnames in the same file). Pass the annotate flag to have the pvalue annotation on the plot
usage: pygna paint-comparison-matrix [-h] [-r] [-s] [-a] table-filename output-file

positional arguments:
  table-filename        pygna comparison output
  output-file           output figure file, specify png or pdf file

optional arguments:
  -h, --help            show this help message and exit
  -r, --rwr             use RWR is the table comes from a RWR analysis (default: False)
  -s, --single-geneset  use true if the comparison has been done for a single file (default: False)
  -a, --annotate        set true if uou want to print the pvalue inside the cell (default: False)
$ pygna paint-comparison-matrix table_comparison_rwr.csv figures/comparison_rwr.pdf -r -s -a
GNA association volcano
paint-volcano-plot plots the results of of a GNA test of association of a single geneset against multiple pathways. Pass the results table generated by one of the functions and the output figure file (png or pdf). From the results table, a multiple testing correction is applied and the results are those plotted.
The defined threshold are for x: zscore and \(y: -log10(pvalue)\)
usage: pygna paint-volcano-plot [-h] [-r] [-i ID_COL] [--threshold-x THRESHOLD_X] [--threshold-y THRESHOLD_Y] [-a] table-filename output-file

positional arguments:
  table-filename        pygna comparison output
  output-file           output figure file, specify png or pdf file

optional arguments:
  -h, --help            show this help message and exit
  -r, --rwr             use RWR is the table comes from a RWR analysis (default: False)
  -i ID_COL, --id-col ID_COL
                        'setname_B'
  --threshold-x THRESHOLD_X
                        0
  --threshold-y THRESHOLD_Y
                        2
  -a, --annotate        False
